EGEO 450, Foundations in GIS, Fall 2002
LAB 8: Final Lab Project

This page contains lots of graphics and may take a while to load for the first time!
Best viewed at minimum display resolution of 1152 x 864

I proposed to identify all the threatened or impaired water bodies and waterways (303d) in Whatcom County and the zoning around those areas to qualitatively determine possible sources of pollution for those areas. I began this task by isolating Whatcom County from a map of counties of Washington State. I then isolated all water bodies (lakes, bays, harbors,etc) and waterways (streams, rivers, creeks,etc) in Whatcom County from map of all water bodies and waterways in Washington State. Next, I isolated all 303d waterways in Whatcom County from a map showing all such water ways in Washington State. There were no 303d water bodies smaller than 1500 acres that occurred in Whatcom County. The extent of the 303d water ways data layer so such that it could not be added to the project. With some help from Kate, I determined that this data was too small to be seen in relation to the other data layers already in the project. All this data came from the Washington State Department of Ecology and was current as of 1998. Unfortunately, querying by location did not select the desired features from these feature classes. I hand selected all desired features in these feature classes. The next step was to add the zoning for Whatcom County and the City of Bellingham. This data came from the j drive. After arranging the data in a manner facilitating visual analysis, I determined that analyzing the 303d water bodies larger than 1500 acres was the most feasible to accomplish the goals of this project. I determined this because these areas were visible and easily analyzed. This feature was in fact the only one of the three shape files of 303d features that was visible on my map.
I proceeded to label the areas around the 303d sites with the appropriate zoning codes. I found aerial photographs on the Microsoft Terraserver website of the 303d sites in question and included those to assist the reader in visualizing the polluted area and what might be the cause of that pollution. I also included a table of the sites, their zoning and the pollution which qualifies them under 303d.
Those sites with high fecal coliform levels are the following: both Drayton Harbor sites, Lummi Bay, Bellingham Bay outer site a, and Bellingham Bay inner site 2. Fecal coliform contamination is most often a result of animal waste entering a stream system and eventually making its way out to larger bodies of water. Such contamination may indicate livestock raising on land that drains into streams that drain into these larger water bodies. This is probably the case at Drayton Harbor site b. If one looks at the aerial photograph, a river drains into the Harbor close to the site of pollution. The aerial photograph shows farmland further up the river. The mixing of the river water and the water in the harbor could easily have carried this pollution a short distance away from the river outlet to where we see the polluted site.
Also of interest are the sites with large quantities of inorganic chemicals. These sites are Bellingham Bay inner site 4 and Georgia Strait site b. The areas around these sites have long been used for heavy industrial activities. In the case of Bellingham Bay, the pulp mill and chlorine plant of Georgia Pacific operated at that site for at least 30 years. One of the major oil refineries along the west coast is located at the Georgia Strait site.
The industrial use at and around the Fairhaven ferry may accounts for the heavy metals, pcbs and phenols seen at Bellingham Bay site 1. The pollution at Bellingham Bay outer site B may be due to the Post Point Water Treatment Facility outlet being located about that far offshore. Although this water has been treated with accepted water treatment procedures, it is still not the same in all respects to the water in Bellingham Bay and may influence the water quality of the Bay in that location.
The dissolved oxygen problems at Lake Whatcom may be due to the proximity of Bloedel-Donovan Park and large amounts of single family houses in the area. In some cases, residential areas have been to known to cause pollution problems because of pets and the large amount of runoff coming from the associated roads and driveways. Low dissolved oxygen levels are indicative of large amount of biological oxygen demand which is produced from large amounts of bacteria which appear when excess nutrients are in the water. These nutrients get into the water from the fertilizer that homeowners commonly apply to their lawns. What is good for plant growth on land is also good for plant growth in the water.
In conclusion, I found that most (4) of the 303d sites occurred around areas zoned for public use in the City of Bellingham, areas zoned industrial were close to 3 sites, are areas zoned for varying levels of residential use were close to 4 sites. This leads me to conclude that areas where people congregate lead to pollution as is seen with the pollution around Bloedel-Donovan and areas where industry is lead to particularly harmful pollution such as seen in Bellingham Bay. Further analysis of the data revealed that Whatcom County has a slightly higher percentage of 303d sites in water bodies larger than 1500 acres than the state of Washington does.


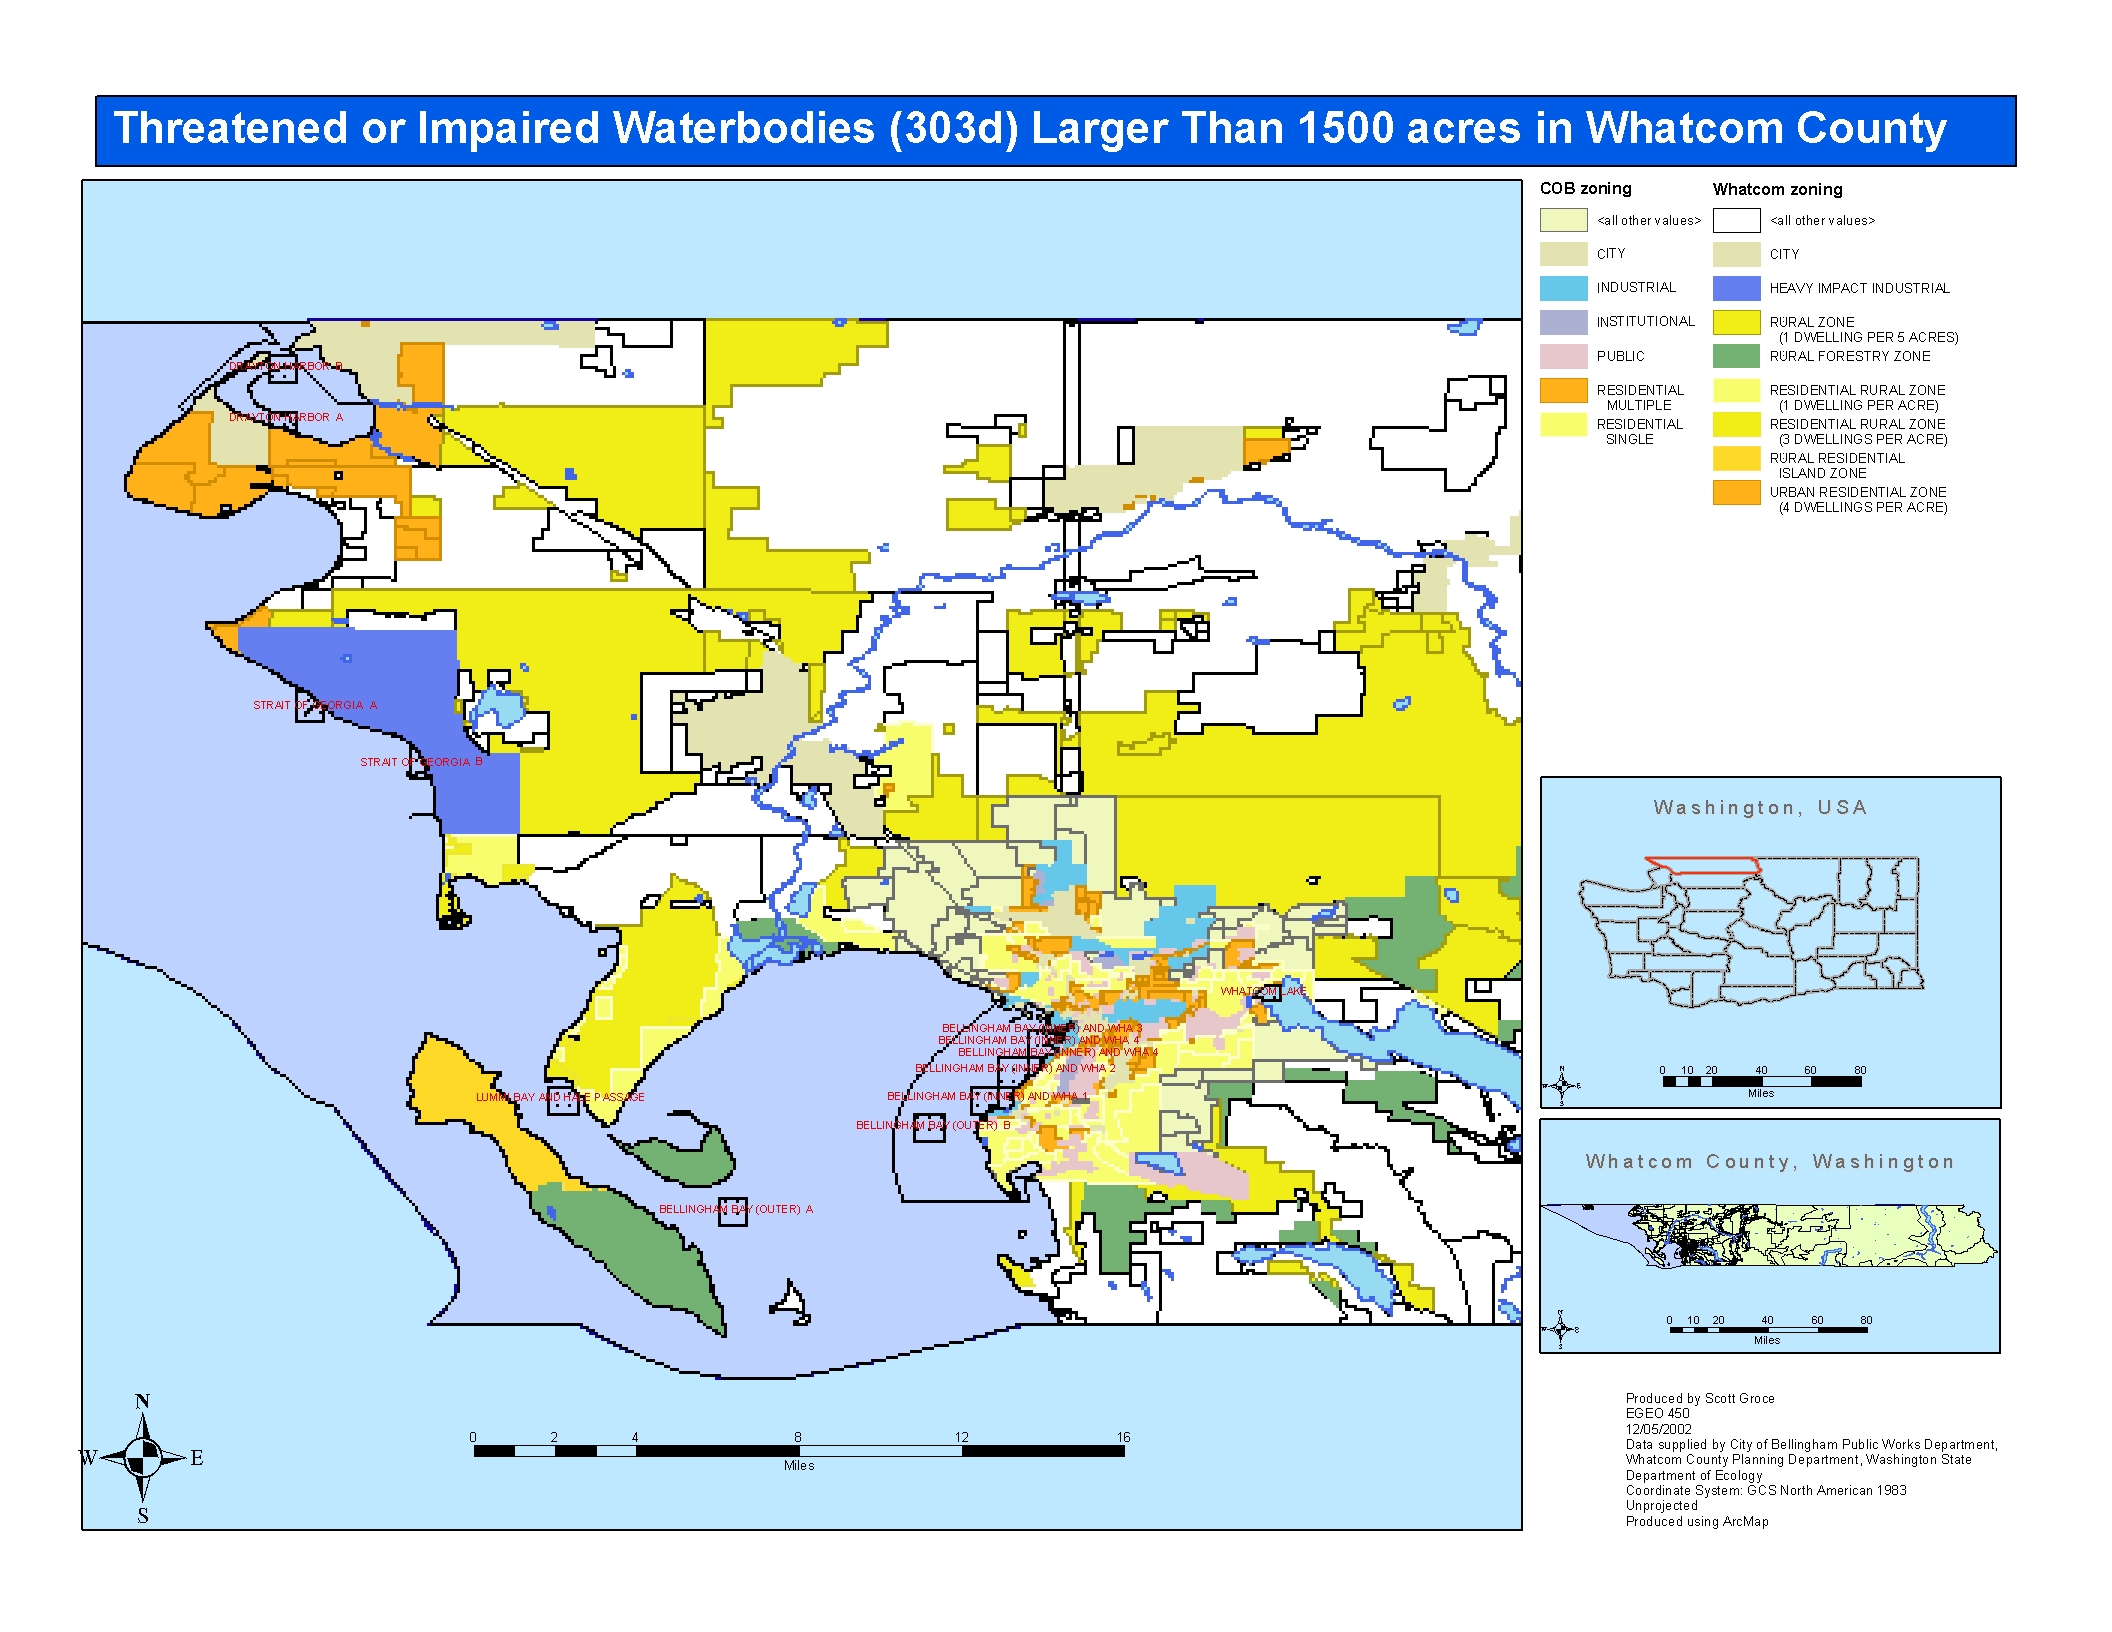
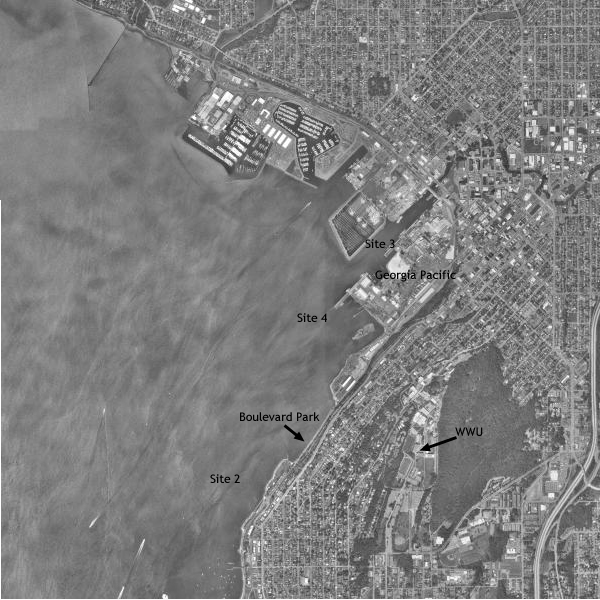
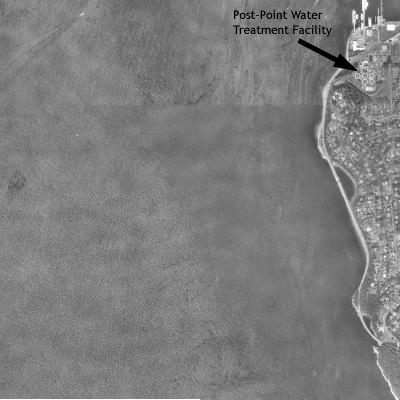
Click to Enlarge (2112 x 1632)

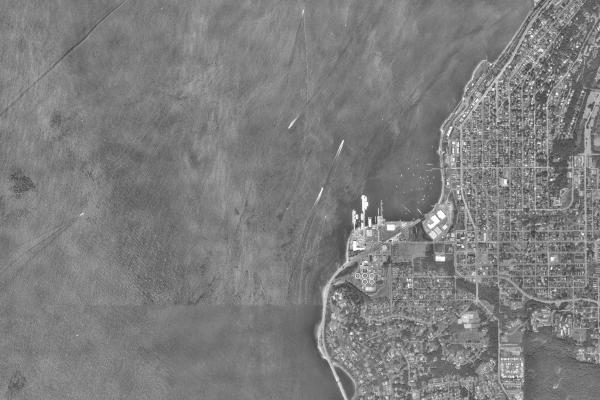
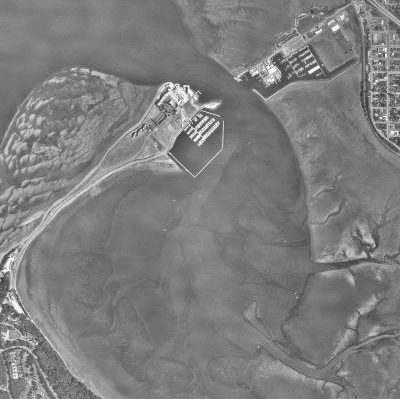
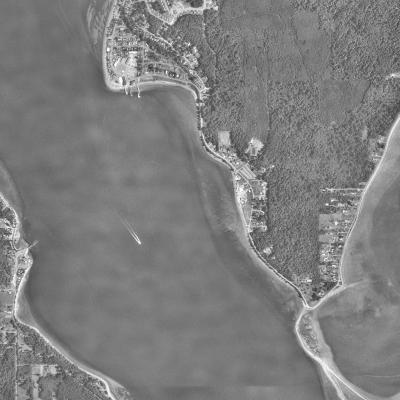
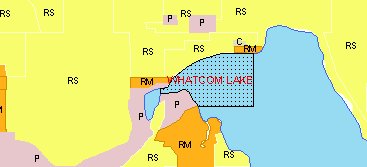
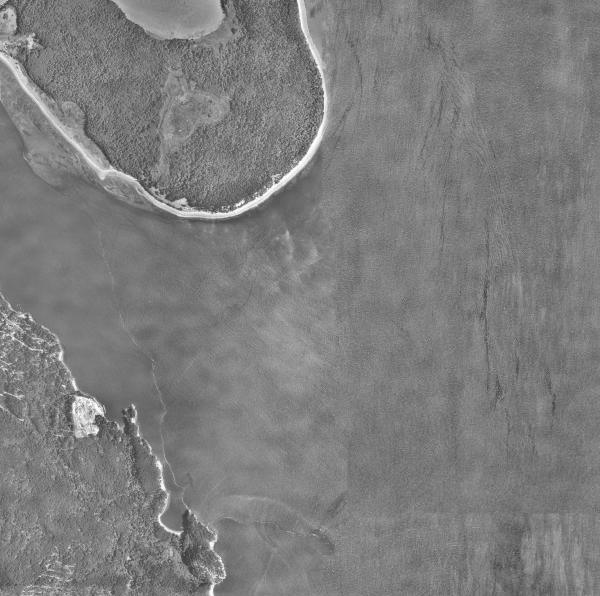
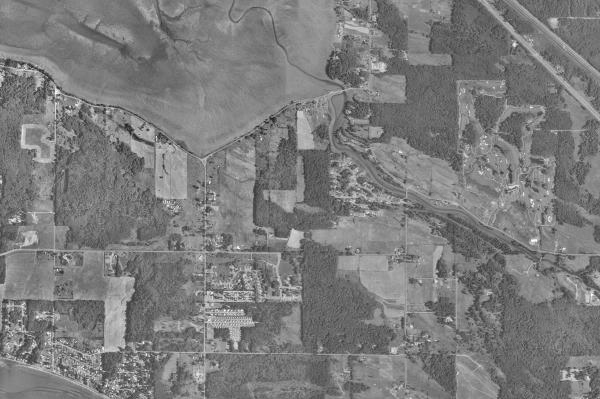
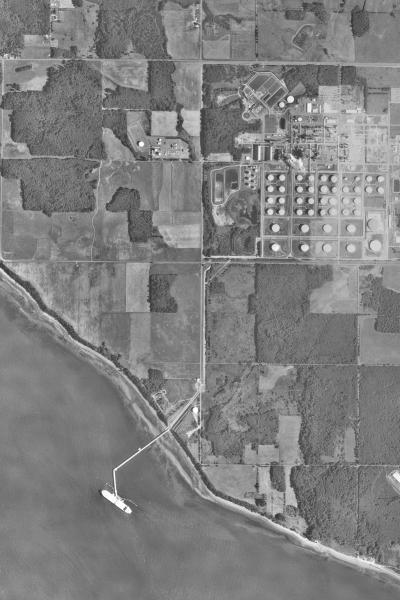
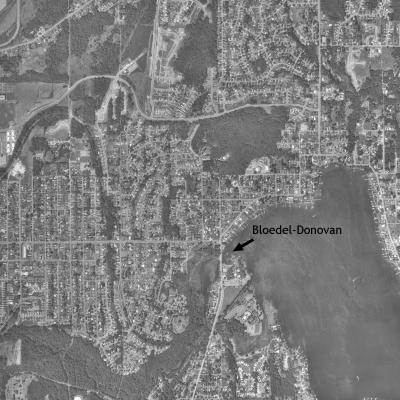
Aerial imagery courtesy of Microsoft Terraserver and USGS. Imagery is black and white, 8m pixel resolution, from 16 July 1998.
Bellingham Bay (inner) Site 1
Bellingham Bay (inner) Sites 2,3 and 4
Bellingham Bay (outer) Site A
Bellingham Bay (outer) Site B
Drayton Harbor Site A
Drayton Harbor Site B
Georgia Strait Site A
Georgia Strait Site B
Lummi Island and Hale Passage
Lake Whatcom