Lab 2
Bellingham
Herald News Story
What are the questions or issues?
The main question from this story is where desalination plants might be
placed to maximum use and minimize cost.
How will you use GIS to answere these questions?
I will use GIS to identify areas along the California coastline that are of
sufficient size, owned by local or state governments, and close to
population centers to provide useful services to as many people as
possible. That sounds pretty ambitious, so I think I'll try to identify areas in Whatcom county that a desalination
plant might be constructed if we had the same water supple problems as California.
How will you communicate your results?
I would communicate my results with a map of Whatcom County highlighting
those areas that are appropriate for a desalination plant.
What data sets, and tools are required for you to accomplish these
tasks?
A map of the Whatcom County coast that included cities would be required for
this project. Also a dataset of county zoning would be helpful and a dataset of endangered
species habitat. I would need to know how big the desalination plants
would be, how the water would be distributed, and how they would be
powered. I would use ArcGIS to compile and analyze the data.
How could you acquire these data sets, and get access
to these tools?
I would aquire these datasets from the J Drive and the City of Bellingham and Whatcom County websites. For the
information about the desalination plants I would contact the people for whom the plants were
being built. The endangered species dataset could come from the state of Washington or the federal government.
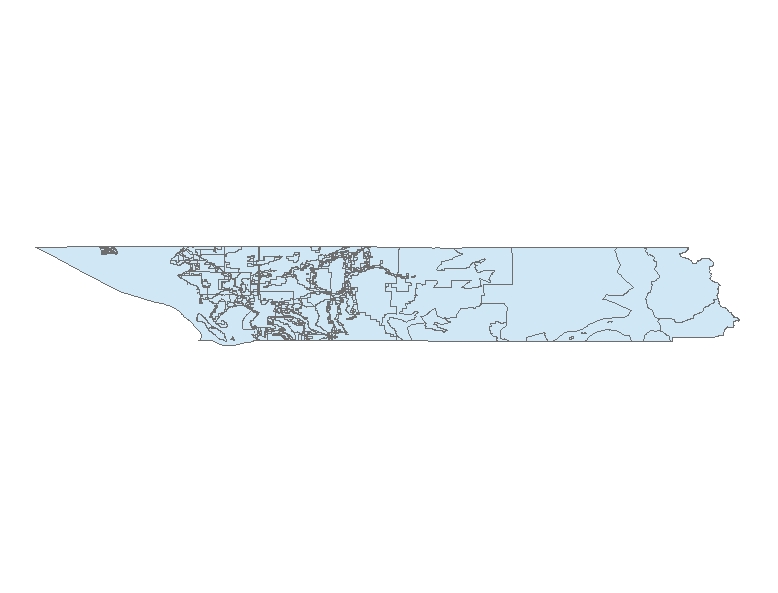
This image shows the zoning data for Whatcom county and the shoreline. It is one of
the datasets required to place desalination plants.

